This article is devoted to the debugging process within Sitecore assemblies. Particularly, I’m going to tell you how you can quickly and easily debug external Sitecore binaries (libraries) using JetBrains Rider.
The Backstory
Before we start, I’d like to tell you about what triggered me to write this article.
Today, Sitecore for a .NET developer is a huge framework that includes many modules consisting of a large number of assemblies. And we, Sitecore developers, are obliged to study certain Sitecore libraries (DLLs), resorting to such a process as code decompiling.
Quite often, to solve a problem, we need to debug the code within our Sitecore instance. But experience has shown that it is not always possible to quickly configure Visual Studio to debug third-party code.
I used to face this issue myself, and recently, this happened to my colleague: he needed a couple of hours to configure the debugging of Sitecore DLLs using Visual Studio and the mechanism of PDB files.
And here I decided to share how I have been debugging Sitecore DLLs for more than a year now using the wonderful IDE — JetBrains Rider.
In short, JetBrains Rider is a cross-platform .NET IDE based on the ReSharper engine — yes, the one ReSharper beloved by many .NET developers.
Let’s Go!
So, I have a Sitecore Habitat local environment — http://habitat.dev.local.
Let’s image we need to debug a Sitecore Item Resolver processor — one of the main processors of the HttpRequestBegin pipeline. We know that this resolver is a Sitecore external code located in Sitecore.Kernel.dll binary. That means that we need to debug the code that is not developed in our Sitecore Habitat solution.
Steps to Debug the Code
1. Download and install Rider (for the first time, you can use 30-day trial period)
2. Run Rider as administrator
3. Open your Habitat solution
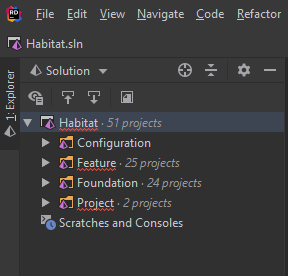
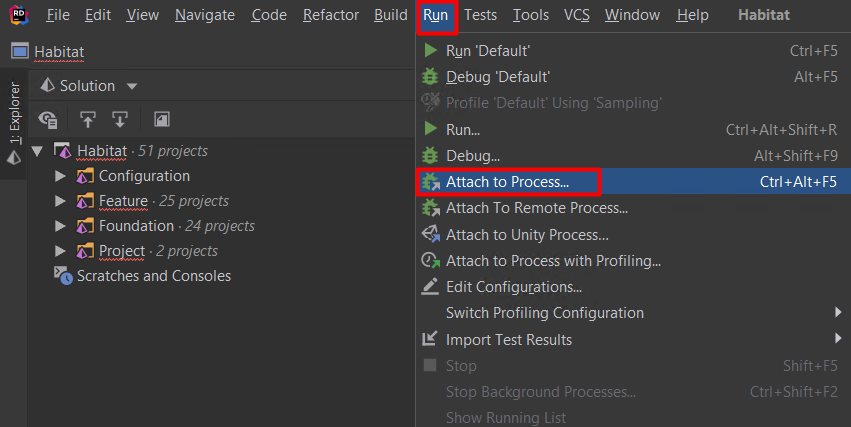
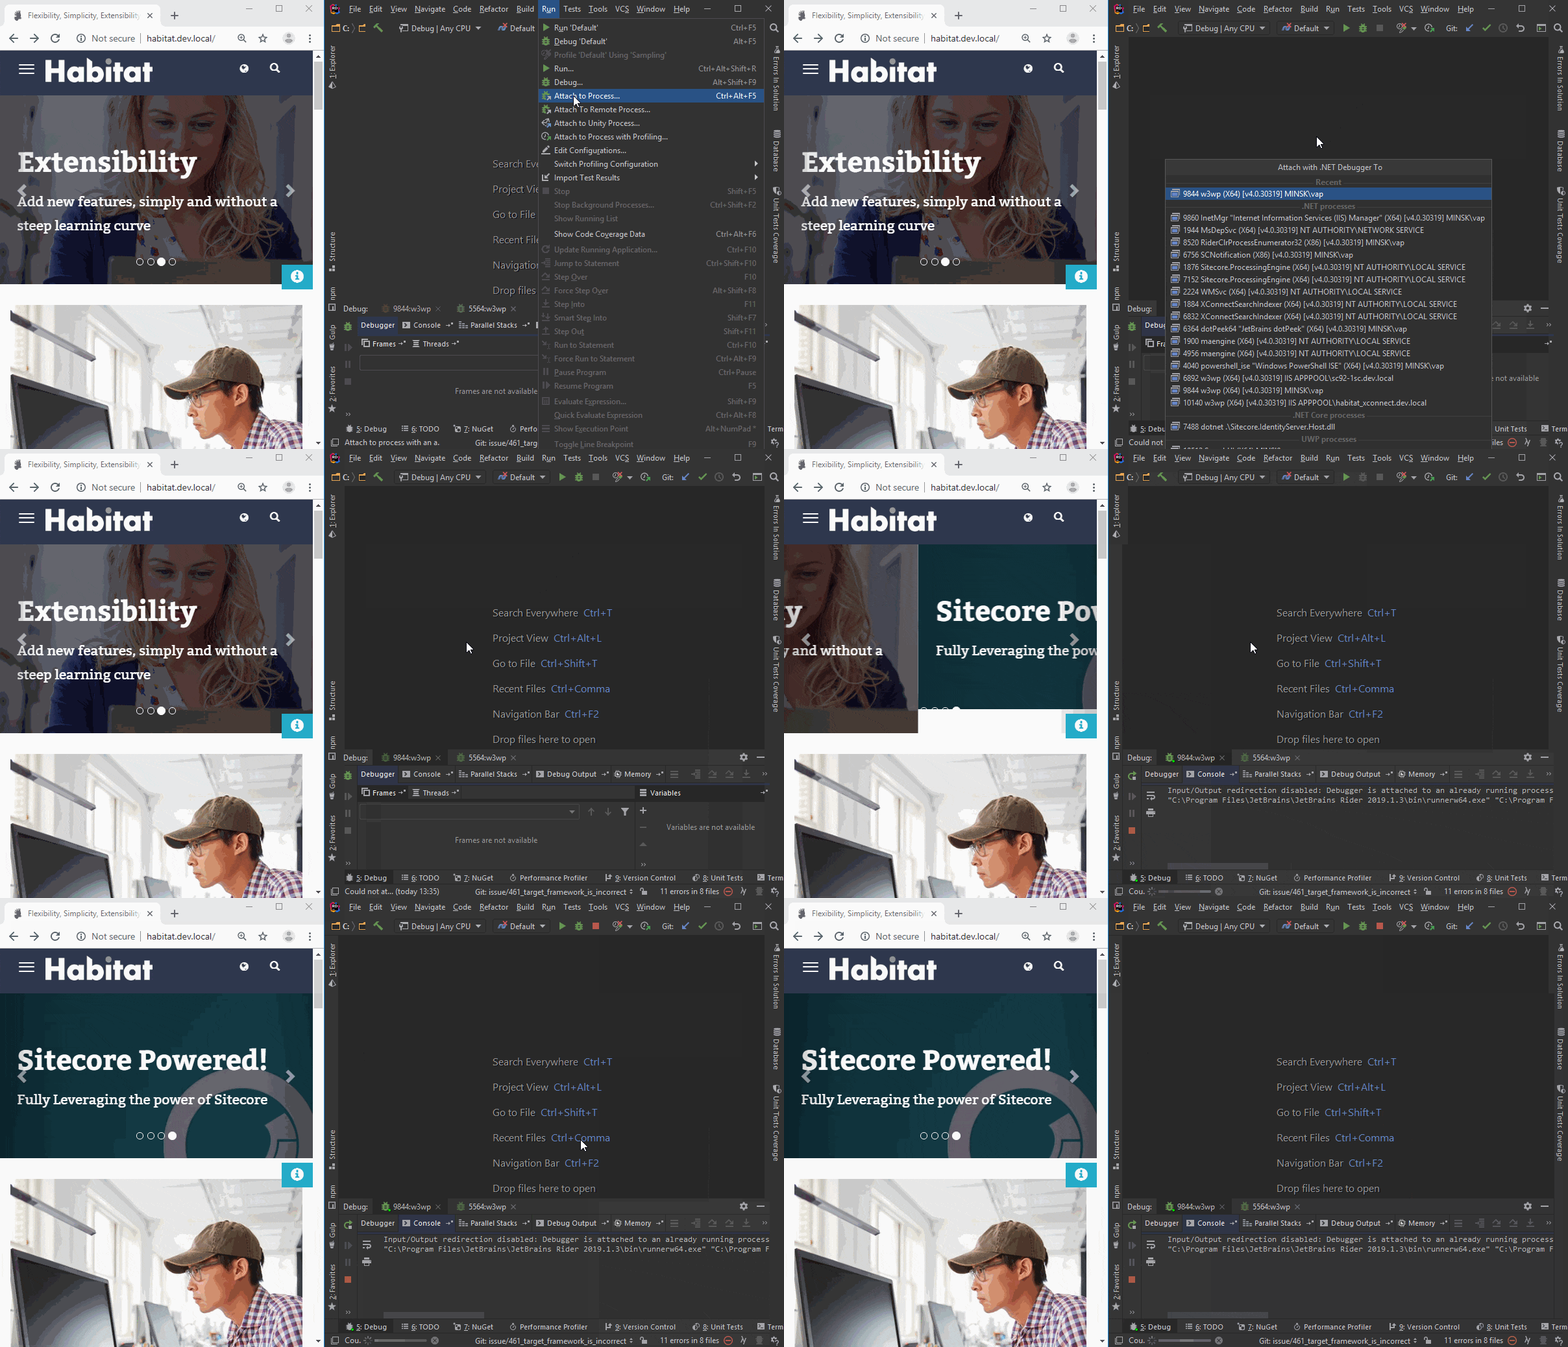
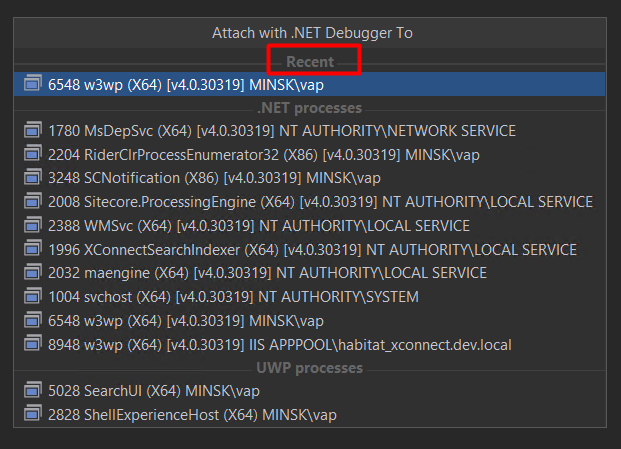
4. Now it’s time to attach to your Sitecore instance. Just jump to the Run top menu and click Attach to Process.
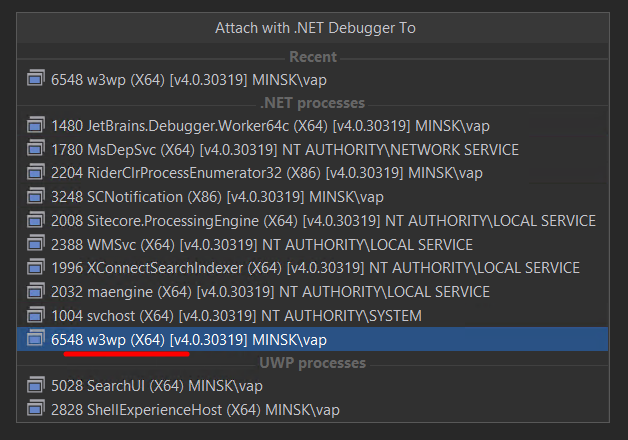
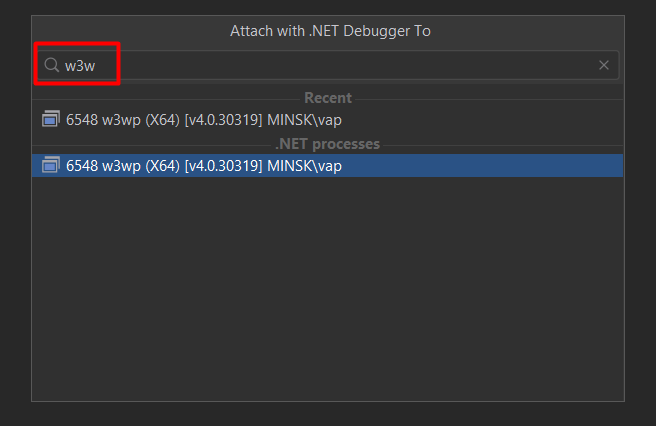
In the open window (Attach with .NET Debugger To) find a target w3wp process:
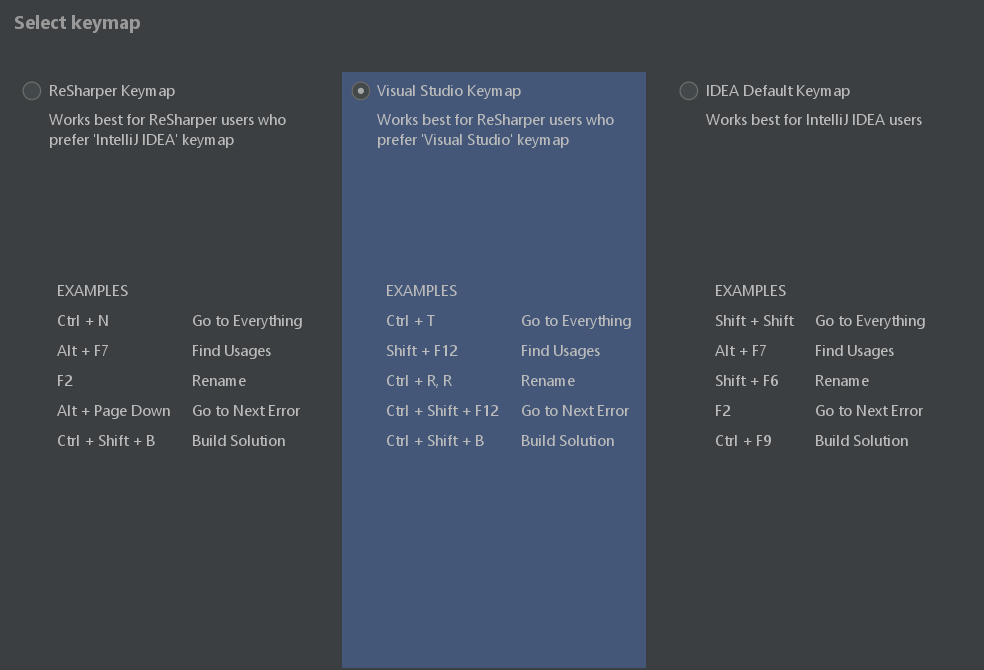
Note: You can use a hotkey — CTRL+ALT+F5 (in my case, I use Visual Studio keymap settings, but you can use others, e.g. Resharper hotkeys).
The Attach with .NET Debugger To window allows us to search w3wp process by inputting the relevant text:
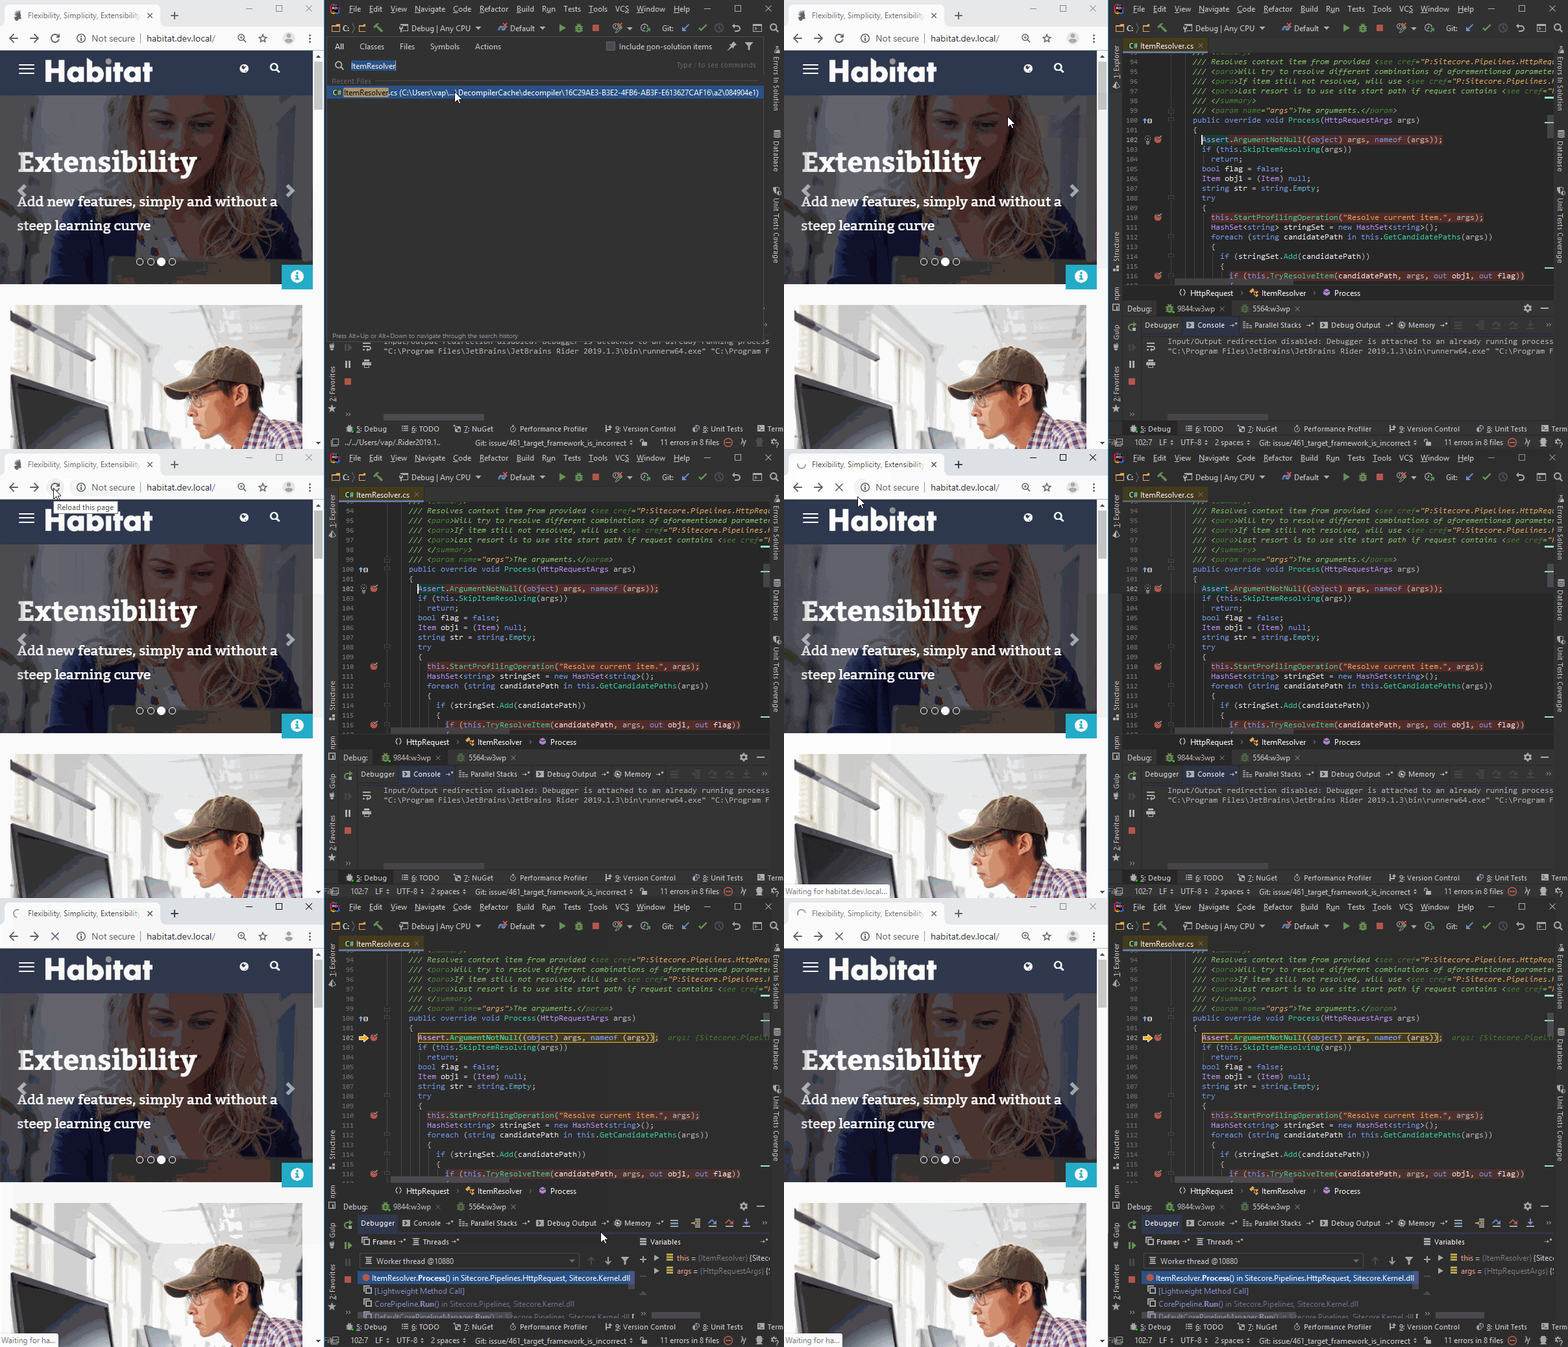
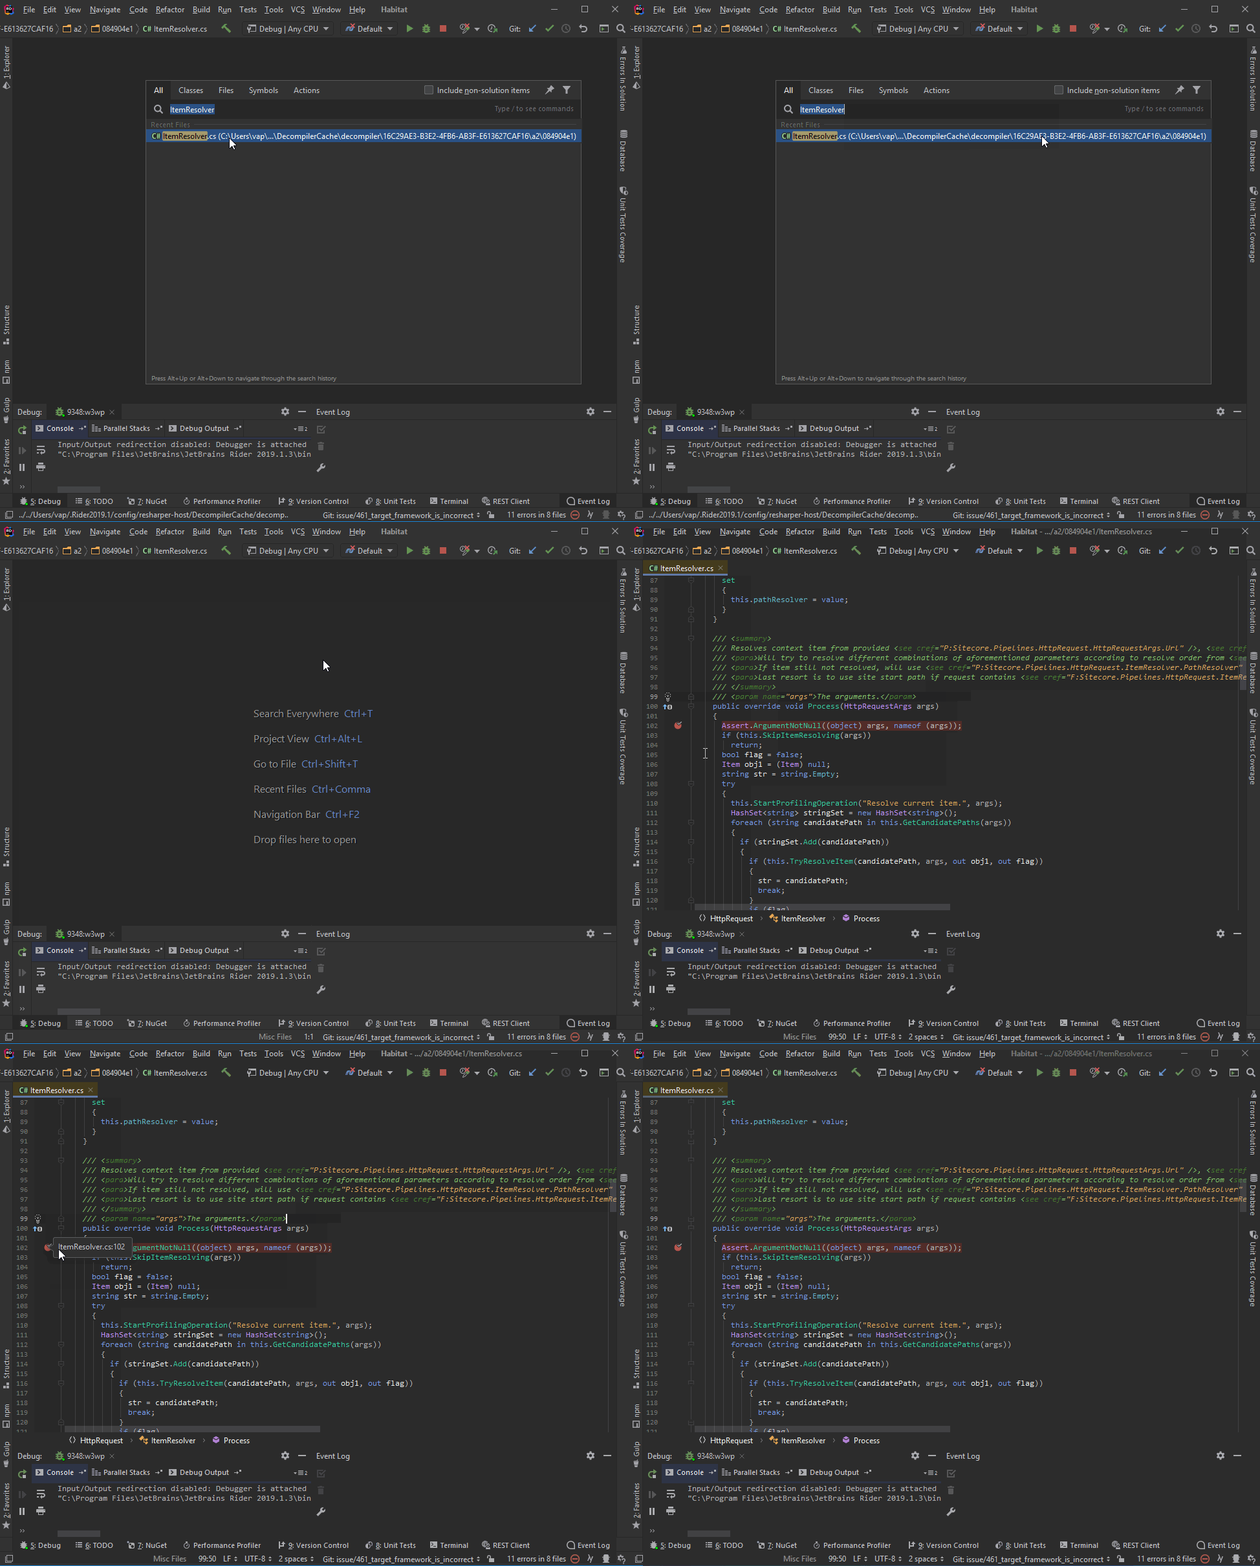
5. Now we need to find our target Sitecore ItemResolver class. The quickest way to do that is to use a hotkey — CRTL + T (or CRTL + N, if you use ReSharper keymap settings). Input ItemResolver in the search field of the appeared window:
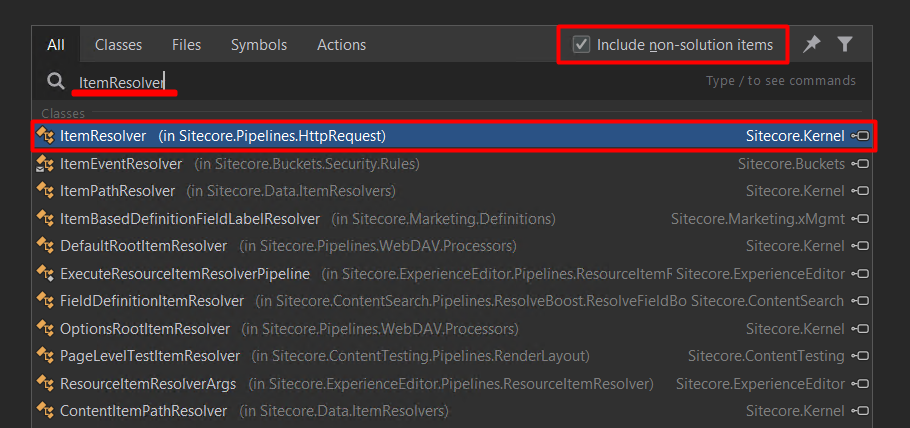
Make sure that the Include non-solution items checkbox is checked, thus the Rider will search not only binaries referenced in your solution, but also through all binaries hosted under the attached process. And this is why you first need to be attached to a target w3wp process (step 4).
6. When the Rider finds the target you search in step 5, just click it and observe the decompiled code that will appear on the screen:
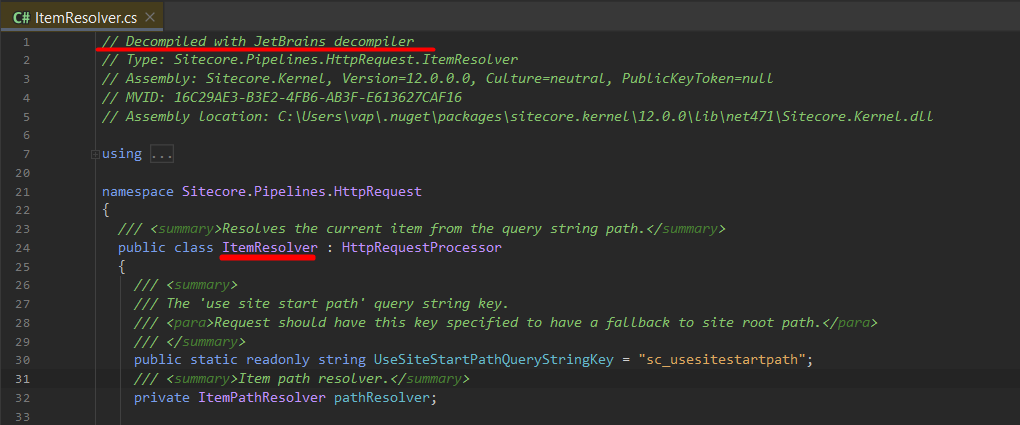
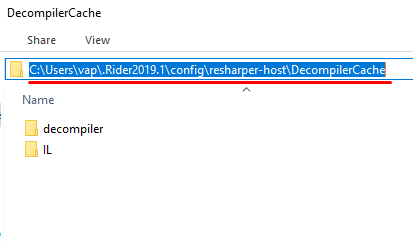
All the decompiled code is stored in the cache folder:
C:\Users\[your user]\.Rider2019.1\config\resharper-host\DecompilerCache\
Next time when you need to debug already decompiled binaries, Rider will take it from the cache folder.
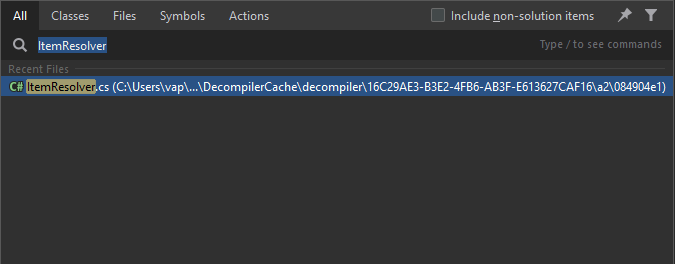
Certainly, you can delete all the cached stuff if you need to.
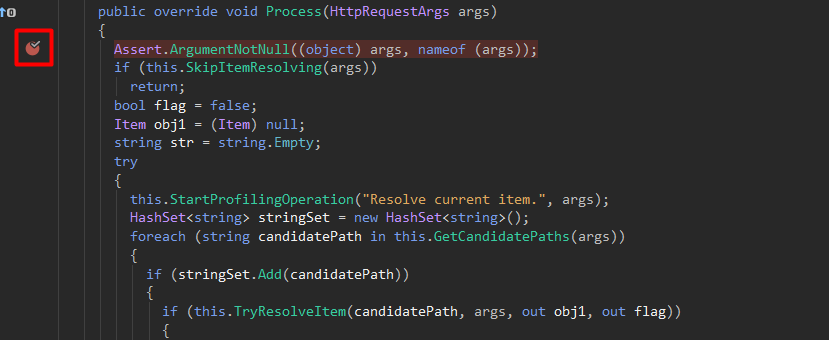
7. Add a breakpoint into the decompiled code wherever you need (in our case, I would like to debug a Process method):
8. Now, you can debug Sitecore DLLs with minimum effort:
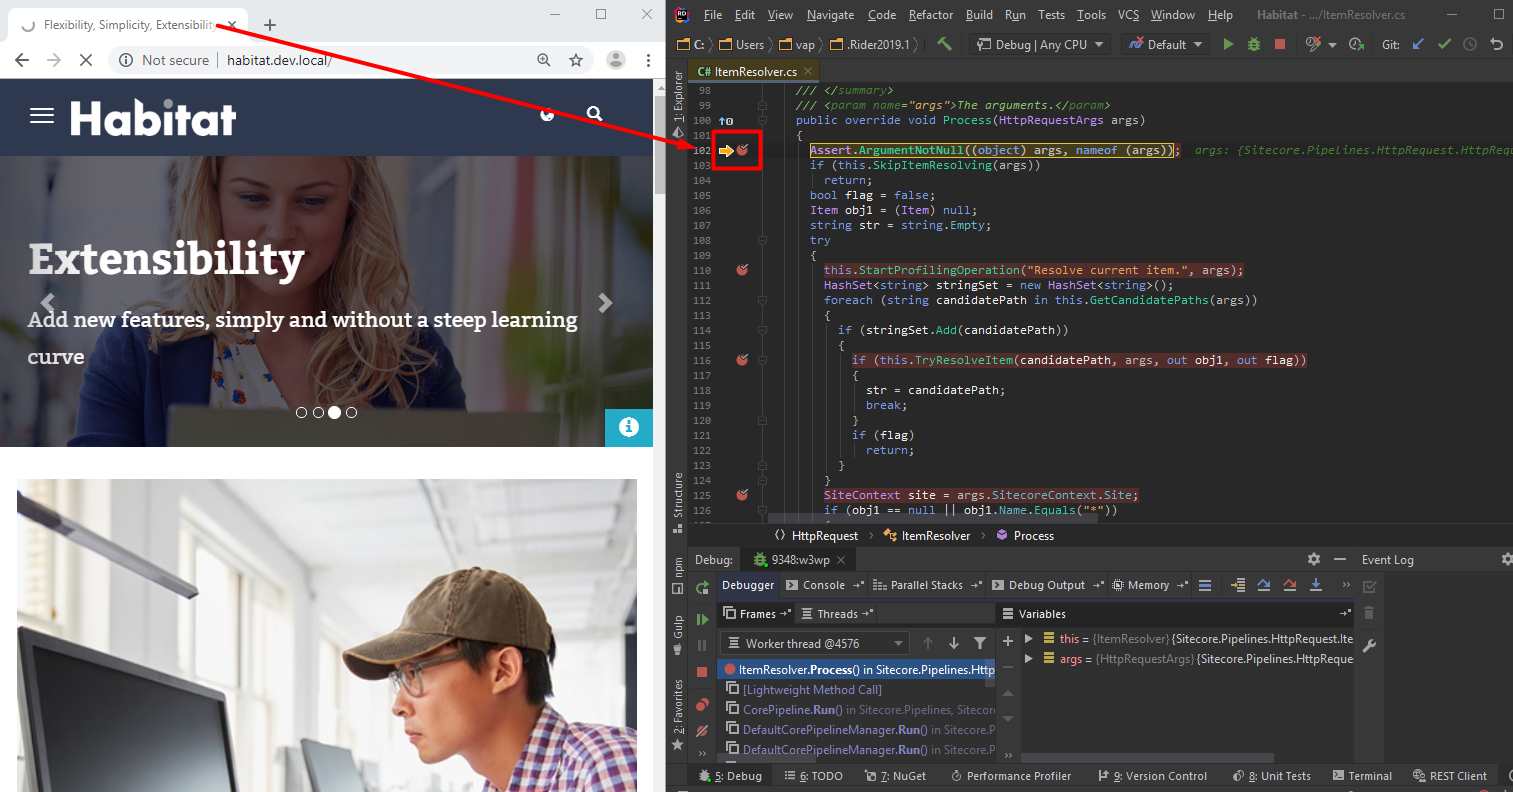
Well, just a few steps are needed to debug not your DLLs (in our case Sitecore) in your Sitecore instance!
Below you can see gif pictures where I recorded these steps:
1. Attach to process
2. Debugging
Some Great JetBrains Rider Benefits
Next time you open Attach to Process window, you will see the Recent section that allows for attaching to the w3wp process even faster.
- All the decompiled binaries and breakpoints are set up into Rider stores in its cache folder
(for Rider 2019.1 – C:\Users\[youruser]\.Rider2019.1\config\resharper-host\DecompilerCache\)
So, if you need to debug decompiled code later one more time, you will be quickly navigated to the target code. Moreover, all breakpoints that have been added previously will be attached:
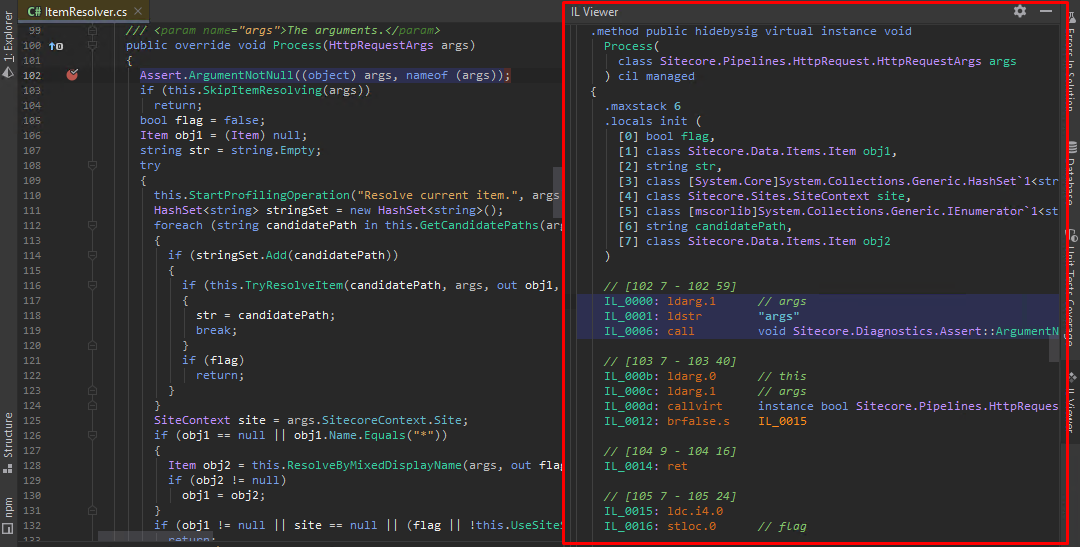
- IL Viewer — yes, you do not need to use some extra tools such as ILDasm, ILSpy, or .dotPeek to view the Intermediate Language (IL) code of your C# code
- If you know and like ReSharper (R#) in general, you will fall in love with Rider J
Summary
To debug third-party binaries using Rider, you need just a few steps:
- Open Rider
- Attach to your Sitecore instance
- Using Go To (CTRL+T is Visual Studio keymap, CTRL+N – ReSharper keymap) find a target binary, class, method, etc.
- In decompiled code put a breakpoint where you need it
- Done! Debugging third-party code is easy!
Happy debugging 🙂


 The Latest 15 Information Technology Trends in 2024
 Top 10 Embedded Software Development Tools
 IaaS vs. PaaS vs. SaaS: What’s the Difference?
 10 Examples of Predictive Analytics


![Sitecore Experience Manager Cloud (XM Cloud) [Complete Guide]](https://www.sam-solutions.com/blog/wp-content/uploads/2022/11/Sitecore-Experience-Manager-XM-Cloud.png)
![Why You Should Upgrade to Sitecore 10 [including the Sitecore 9 vs. 10 comparison]](https://www.sam-solutions.com/blog/wp-content/uploads/2022/09/Why-upgrade-to-sitecore-10.png)


![[TechSpeak] Migrating a Legacy Solution to Helix Architecture: a Step-by-Step Guide](https://www.sam-solutions.com/blog/wp-content/uploads/2021/02/Migrating-to-Sitecore-Helix-Architecture-image-1-1024x660-min.png)


 Web App Development Cost in 2025 [Key Price Factors]
 13 Best React Development Tools in 2025
 Top 10 Mobile App Development Trends 2025
 Top IoT Industry Trends in 2025
 Java Web App Security: Everything You Need to Know
Short but very accurate information… Many thanks for sharing this one.
A must read article!